Visualize Your Data
Blown up into charts and interactive graphics, your data can tell compelling stories or truths about your business—truths that take a lot of cognitive processing before they can be wrested from rows and columns.
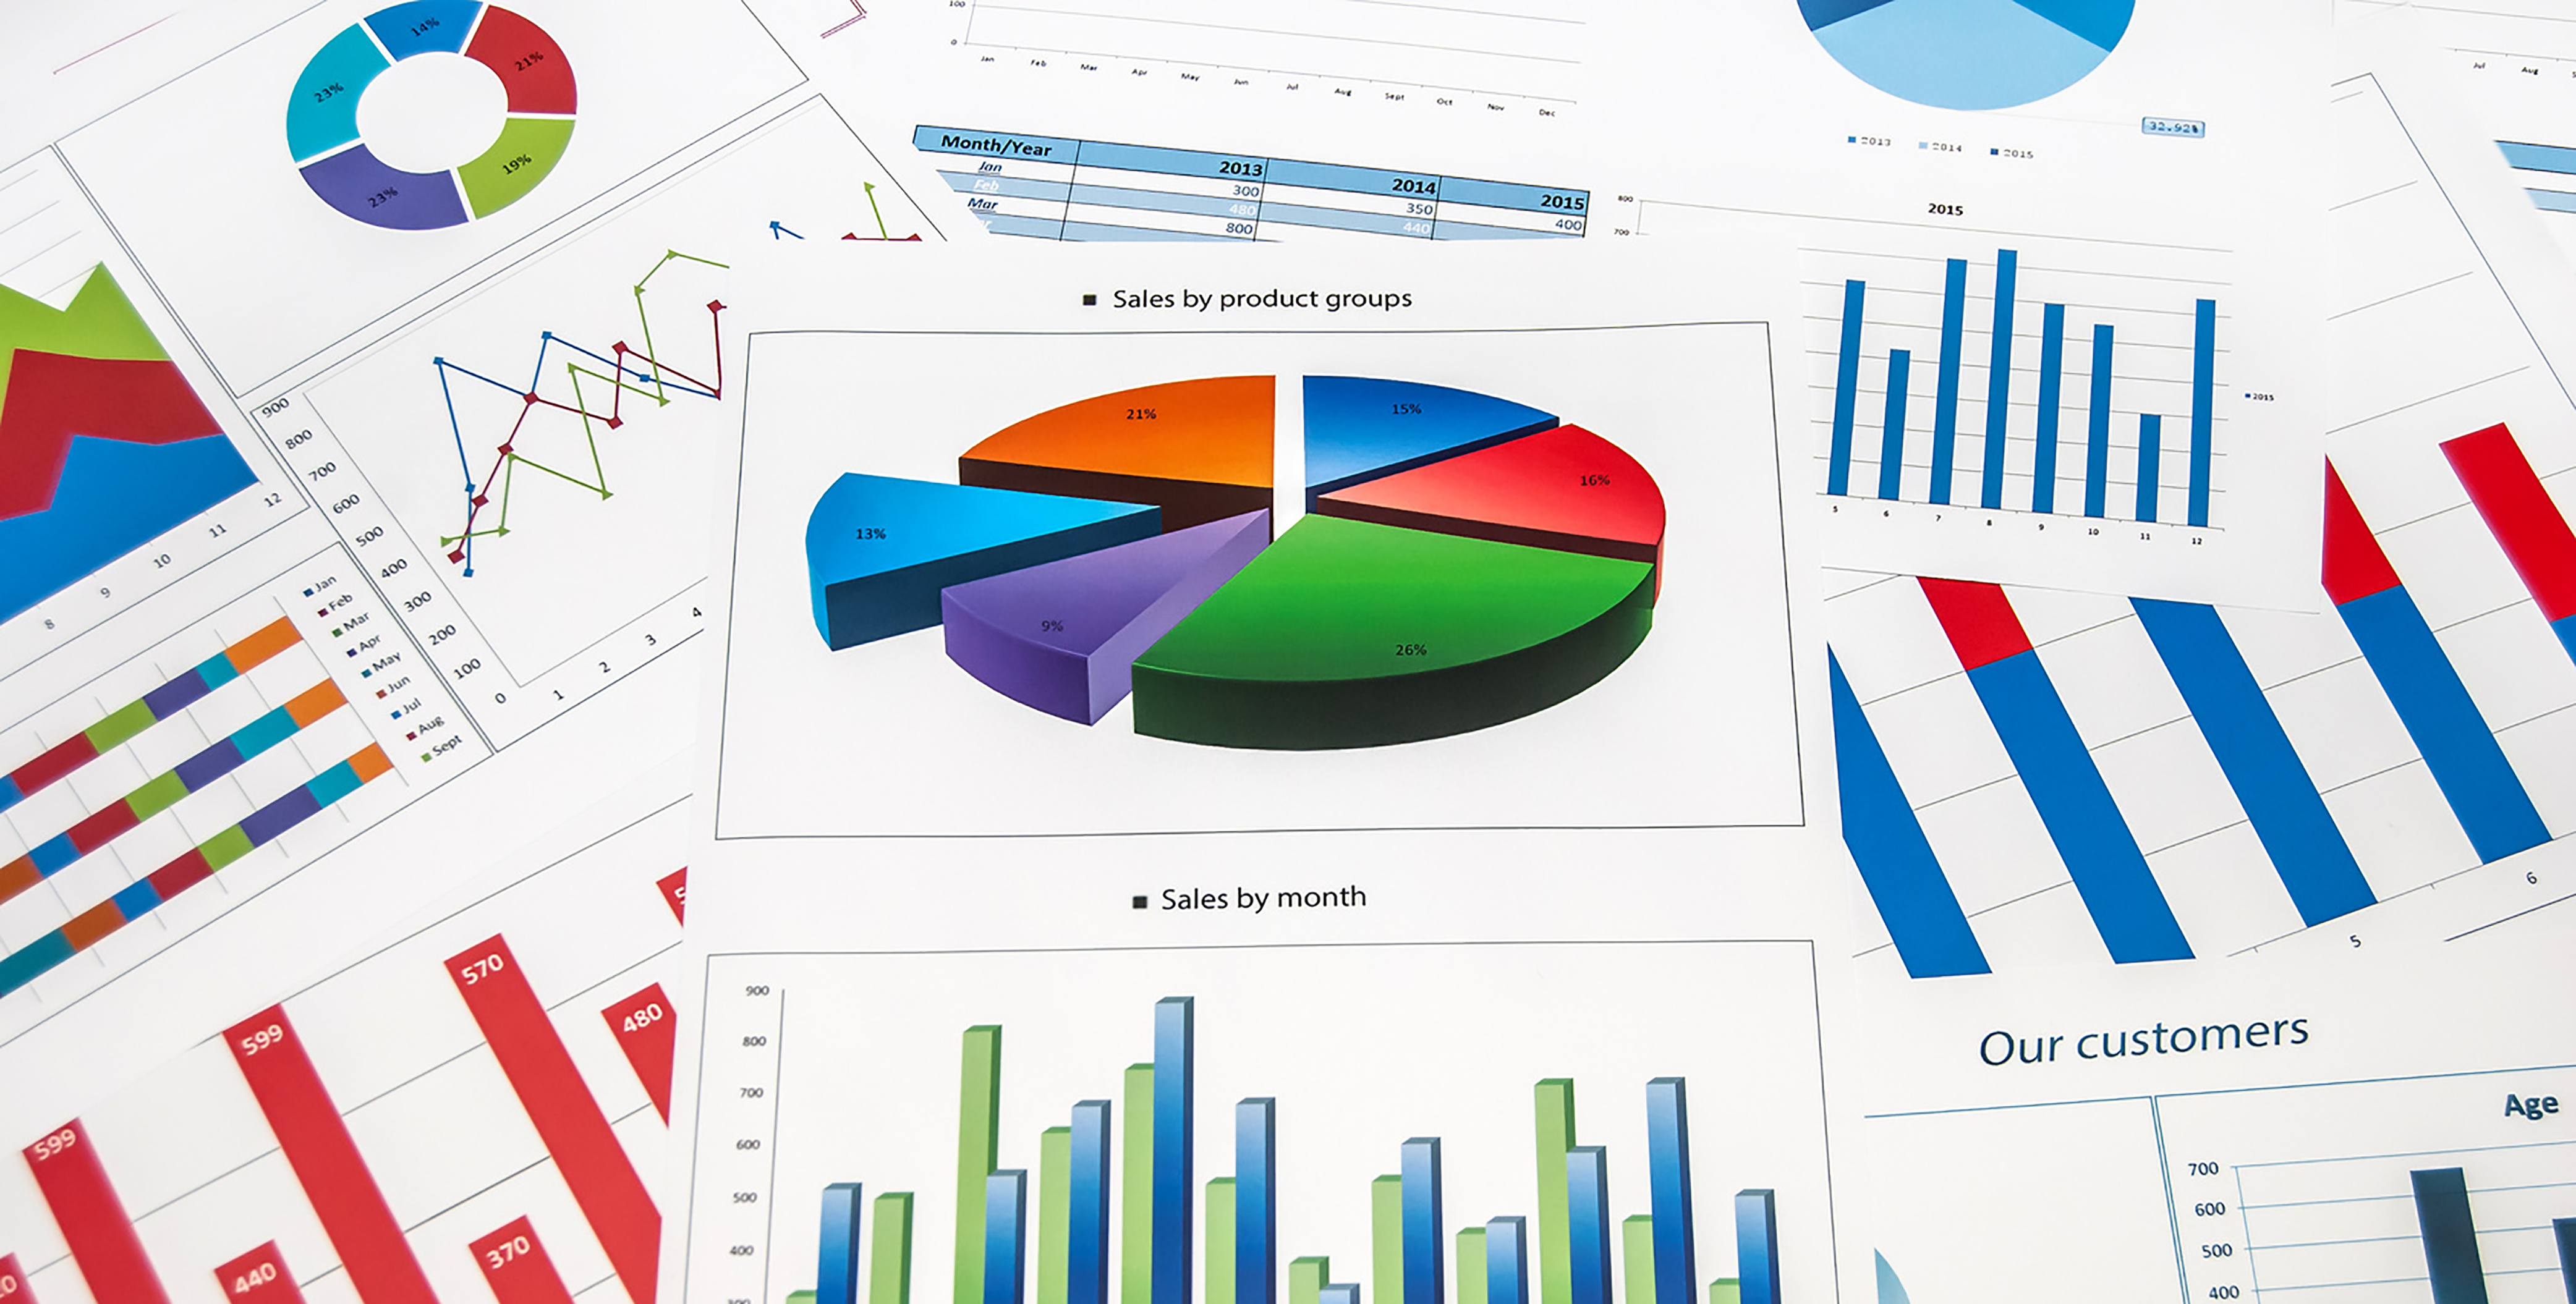
Data visualization is the graphical representation of information and data. By using visual elements like charts, graphs, and maps, data visualization tools provide an accessible way to see and understand trends, outliers, and patterns in data.
Visualization demystifies and enhances the power of analytics, leading to rare insights, quick decisions, and real-time actions. Discover the power of your data with our expert services in visualization.
We are experts in creating visual dashboards that collate summarized information, drill-down representations, trends, statistical graphics